35 Reading the Spectrogram (macOS)
The spectrogram in the Tabbing song view gives you a rich and powerful visualization of your music. Compared with the flat view of a typical audio waveform, the spectrogram shows you the intensity of notes over time.
By viewing music with the spectrogram, you can deduce all kinds of information that is not at all possible in a waveform display. Here are some examples of spectrograms collected from a Stevie Ray Vaughan guitar performance, demonstrating various techniques that can be gleaned from the spectrogram.
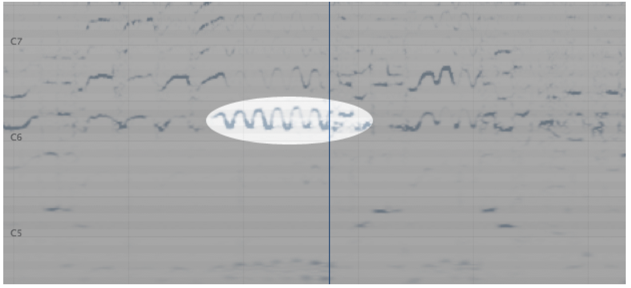
35.1 Vibrato
Vibrato is quite easy to detect, as it typically has a very obvious pattern to it. Capo’s spectrogram doesn’t just tell you that the bend is there—you are also able to deduce both the depth and rate of the vibrato using the spectrogram.
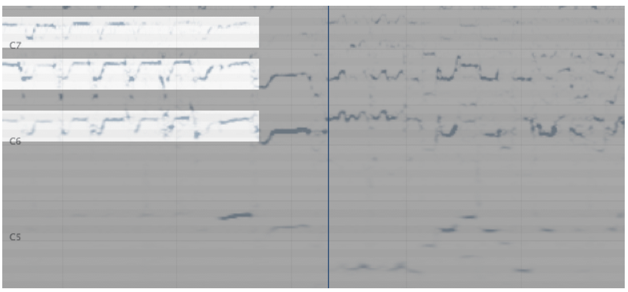
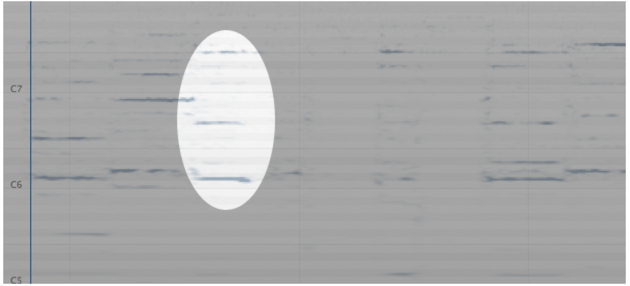
35.2 Bends
A bend can sometimes look similar to vibrato if it’s done quickly, but the telltale sign of a bend is that two distinct notes have a clear connection between them. By comparison, you won’t see the start and end note held for very long in vibrato, and the pitches often over- or under-shoot the target.
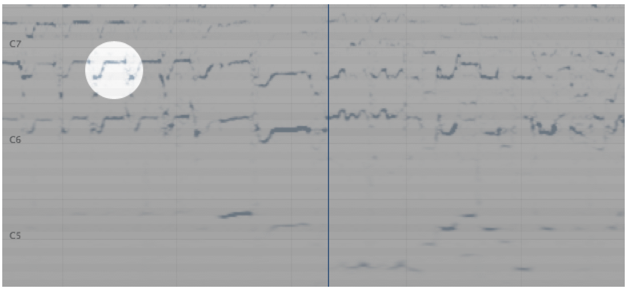
35.3 Slides
A slide is usually easier to hear than to see, but Figure 35.3 captures a good clear example of them.
If you’re unsure whether you’re looking at a slide or a bend, the bend will have a more continuous path from the start to the end pitch, because nothing stops the string from producing the notes in between the semitones.
Another dead giveaway is the distance: you’ll rarely find bends that go past 2 semitones, and even fewer go past 3.
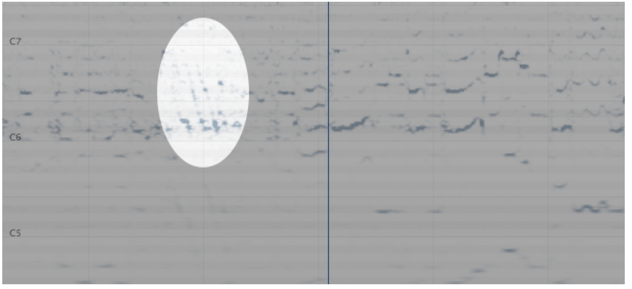
35.4 Chords
When a chord is strummed on a guitar, you will often see notes being produced in a group such as the ones pictured below. Using the spectrogram to identify chords like this can help you identify a particular voicing of a chord you hear.
It’s easy to mistake a set of harmonics for chords, so use your ears to guide your choices.
35.5 Harmonics
When you play a note on most instruments, it will generate many frequencies—not just the one you played. For example, C4 (middle C) has a frequency of 261.6Hz. But if you play a C4 on a piano, you are also creating energy at its 2nd harmonic (523.3Hz, an octave up), its 3rd harmonic (784.9Hz, or G5—a perfect fifth up), and so on.
Most of the time, the loudness of these harmonics drops off. But each instrument will contribute differently to this harmonic energy. In some cases, the fundamental frequency (e.g., 261.6Hz in a C4) doesn’t appear at all!
This is most common with distorted guitars as illustrated in Figure 35.4. While there is clear energy shown from C#6 to D#6, your ears (correctly) interpret this as a C#5/D#5 bend. In situations like these, you follow your ears and mark the entries for a C#5/D#5 bend, despite no clear indication of any energy there.